|
| |
Table of Contents
I. ECONOMIC AND
MARKET PROFILE
79th
Street Corridor Area Industry
79th
Street Corridor Property Values
Transportation
and Infrastructure Survey
Windshield
Housing and Landscape Survey
Problems in
Community: Parking, Crime, Availability of
Locations
V. NEIGHBORHOOD
REVITALIZATION RESOURCES
Neighborhood
Revitalization Resources
Institutional
and Collaborative Support Mechanisms
List
of Tables
Table 4: Labor Force
and
Employment: 1998 to 1999
Table 5: Labor Force
and
Employment: 2000 to 2001
Table 7:
Occupational Employment
Projections: 1996-2006
Table 8: Total
Non-Farm
Employment In Miami MSA
Table 9: Historical
Manufacturing Statistics for Miami, FL PMSA (1977-1997)
Table 10:
Manufacturing
Growth For Miami, FL PMSA (1992/1997)
Table 11:
Manufacturing Employment
Projections 1995-2005: Dade/Monroe Counties
Table 12:
Non-Manufacturing
Employment Projections: Dade/Monroe Counties
Table 13:
Manufacturing
Employment Projections: Broward County
Table 14:
Non-Manufacturing
Employment Projections: Broward County
Table 15:
Manufacturing
Employment Projections: Palm Beach County
Table16:
Non-Manufacturing
Employment Projections: Palm Beach County
Table 17:
Demographic Data:
Tracts Representing 79th Street Target Area
Table 18: Comparison
of
Demographic Data: 79th Street Area and Miami-Dade County
Table 19:
Demographic
Changes from 1990 to 2000: 79th Street Area Census
Table 20: Population
and
Housing Trend Comparison
Table 21:
Establishments
and Employees per Industry
Table 22: Retail
Trade and
Service Industries
Table 23: Current
Sales
Prices in Two Areas
Table 24: Commercial
Property Value
Table 25:
Residential
Property Value
Table 26: Vacant
Property
Value
Table 27: Industrial
Property Value
Table 28:
Significant Commercial
and industrial land Parcels
Table 29: Exterior
Housing
Conditions
Table 30: Revenue
compared
to last year by Area
Table
31: Reason For Choosing Location
List
of Figures
Figure 1: Census Tracts
within the
79th Street Corridor Study Area
Figure 4: Average Employees Per Industry
Figure 5: Interest in Skills Training
Figure 6: Knowledge/Use of Business Organizations
Figure 7: Poorest Business Conditions
List
of Maps
79th Street Corridor Zoning and Large Parcels Map
The
following report concludes the first phase of the 79th
Street
Corridor master planning process. The
purpose of the survey and economic market analysis is to assess the
redevelopment capacity of the 79th Street Corridor and to
help guide
the subsequent phases of the planning process.
The report is delivered to the 79th Street Corridor
Initiative led by the Urban League of Greater Miami, Miami-Dade
Neighborhood
Housing Services and the Dade Employment and Economic Development
Corporation
(DEEDCO) in partnership with the Center for Neighborhood Technology
(CNT). The phase one survey and analysis
was
conducted by Florida International University’s (FIU) Metropolitan
Center and
GIS-Remote Sensing Laboratory.
According
to the 79th Street Corridor Initiative’s planning
prospectus, the
goal of the redevelopment plan is “to transform the district from a
fragmented
set of residential, commercial and industrial sites with a reputation
as
dangerous and undesirable into a cohesive neighborhood conscious of its
tangible and intangible assets and directing its future.”
The Initiative intends “to build on the
considerable assets of the community, including tangible assets such as
the
skills of residents, public transportation, land available for
assemble,
undervalued market potential, job access, rail freight and
right-of-ways, and
intangible assets such as the sense of place, knowledge of the
community, and
location efficiency.”
The
project area and initial focus of the 79th Street Corridor
redevelopment plan is the western end of 79th Street bounded
by NW
22nd Avenue to the east; East 10th Avenue in the
City of
Hialeah to the west; NW 87th Street to the north; and NW
71st Street
to the south. The project area has been
identified as a “special development district” that is envisioned to
become a
model sustainable development project based on an integrated approach
to
neighborhood development tying together economic opportunity, quality
of life
and environmental improvement. The
project area has experienced decades of economic disinvestment and
social
unrest but has enormous redevelopment potential given its highway
access,
proximity to rail and mass transit hubs, commercial and industrial
land, and
stable single-family neighborhoods.
Identifying and understanding these factor and neighborhood
conditions
is an essential first step in the master planning process.
The 79th
Street Corridor Survey and Economic Market Analysis is divided into
five
sections. The Section I-Economic
and Market Profile provides an overview of the Miami-Dade market
including
an analysis of Miami-Dade’s most important
business sectors, real estate, and employment and labor markets. This is followed by analysis of the 79th
Street Corridor study area: its demographic trends, major
industrial/employment
sectors, and real estate values. Section
II-Land Use begins with an overview of the existing zoning
followed by
summaries of the transportation, streetscape and housing conditions
surveys. The Section III-Business
Survey analyzes data from face-to-face interviews with local
business owners
and managers within the 79th Street Corridor study area. Field interviews provided a more
comprehensive and qualitative analysis of this relatively small but
unique
business area. The concluding Section
IV-Neighborhood Revitalization Resources provides a summary of
various
funding mechanisms for plan implementation followed by a discussion on
the
importance of establishing institutional and collaborative support
for
the 79th Street Corridor Initiative.
The
79th Street Corridor study area is part of a larger local
and
regional economy. Market factors
including the supply or inventory of land and buildings, acquisition
costs and
lease rates and overall economic conditions will strongly influence
proposed
redevelopment within the study area.
The Greater Miami area is considered the major international
trading hub
of the Americas. It s population,
business community, neighborhoods, schools and architecture all reflect
a
Caribbean and Central and South American flavor.
The
recent downturn in the US economy combined with the negative impacts of
the
September 11 terrorist attacks have exposed the relative weaknesses of
the
Greater Miami economy. Miami and South
Florida’s faltering tourism has had a negative multiplier effect on the
entire
service and retail sectors. However,
according to a 2001 Second Quarter survey Miami-Dade’s industrial
market
remains healthy. This is due to a
substantial increase of South American investments in South Florida,
especially
from Columbia and Venezuela. Freight
forwarding and logistics companies continue to be a strength in the
industrial
market particularly in the Airport West area. Demand for
warehouse/distribution
space remains strong in all Greater Miami locations, while demand for
telecom
space has been drastically reduced. The
Second Quarter report notes that many high-tech companies have pulled
out of
deals in Airport West resulting in an increase in sublease space and a
reversion
of buildings back to warehouse use (Source: CB Richard Ellis).
The
following is a brief profile of Greater Miami’s commercial and retail
markets:
Absorption
in the commercial real estate market was expected to be maintained near
one
million square feet during 2000 and development is expected to increase
during
the current decade. A careful eye will
be kept on the international financial markets and the economic
conditions of
Latin American countries. Increases in
international trade will encourage international businesses to locate
offices
in Miami. The regional economy is
expected to grow at a rate of two percent annually or greater over the
next few
years.
Many
of the sub-markets will experience growth greater than that of Miami’s
Central
Business District (CBD), as Dade County’s growth trend continues toward
west
and north of the city. The figures
presented in Table 1 show the office market inside and outside of the
Miami’s
CBD in 1999.
|
|
Total
Space (sq. ft.) |
Vacant
Space (sq. ft.) |
Vacancy
Rate (%) |
Under
Construction (sq. ft.) |
Net.
Absorption (sq. ft.) |
Gross
Lease ($/sq. ft./yr) |
|
|
Class A |
CBD |
5,410.9 |
503.5 |
9.3 |
525.0 |
230.2 |
20.00-32.00 |
|
Outside |
4,612.2 |
244.0 |
5.3 |
770.7 |
346.1 |
10.45-40.00 |
|
|
Class B |
CBD |
4,114.1 |
651.8 |
15.3 |
N/a |
111.2 |
15.00-28.50 |
|
Outside |
14,591.2 |
1,358.9 |
9.3 |
N/a |
285.1 |
10.00-31.56 |
|
Source: Society of
Industrial and Office Realtors, 1999 Comparative Statistics of
Industrial and
Office Real Estate Markets
New
construction for industrial space was expected to decrease in 1999 by
one to
five percent, which was considered timely because of the nearly two
million
square feet of additions during 1998.
However, the shortage of buildings sized at 100,000 square feet
and
larger encouraged new construction in that market segment.
Many organizations unable to locate these
larger spaces in 1998 were still shopping in 1999-2001.
Recent increases in site prices will make it
more difficult to locate ‘ready to go’ land.
Residential development in the Airport West area is expected to
blur
district boundaries of office and industrial space.
Furthermore, warehouse/distribution prices are anticipated to
increase up to five percent. Lease
prices for this space was also expected to increase by up to five
percent,
while absorption levels are expected to remain constant.
|
|
Total
Space (sq. ft.) |
Vacant
Space (sq. ft.) |
Vacancy
Rate (%) |
Under
Construction (sq. ft.) |
Net.
Absorption (sq. ft.) |
Gross
Lease ($/sq. ft./yr) |
|
Central City |
62,500.0 |
4,687.5 |
7.5 |
0 |
-917.5 |
2.35-3.35 |
|
Suburban |
94,800.0 |
4,929.6 |
5.2 |
1,950.0 |
1,770.4 |
5.65-7.65 |
Source: Society of
Industrial and Office Realtors, 1999 Comparative Statistics of
Industrial and
Office Real Estate Markets
Retail
trade and tourism are Miami’s most important sectors.
Retail accounts for 27% of the area’s jobs and the economic
impact of tourism is estimated to be $13.5 billion.
Both of these industries have changed over the past 15
years. The demographics of Miami’s
millions of tourists have gone from 61 percent American in 1989 to an
estimated
61 percent foreign visitors in 1996. At
the same time, Miami’s retail vacancy rate has stabilized, while the
rent index
rose 4 percent. Shopping center
completions remained robust at 850,000 square feet with that rate
expected to
continue through 2000 (Source: National
Association of Realtors, 1997-1998 Market Conditions Report).
|
Shopping Center Inventory (sq. ft.) |
Shopping Center Construction (sq. ft.) |
Construction as a Percent (%) |
Torto Wheaton Rent Index* ($/sq. ft.) |
|
32, 943.0 |
853.0 |
2.6 |
14.37 |
*Index is based on a model
that predicts what the average rent should be for leases with certain
characteristics, in certain locations and during certain years.
This
section looks at Miami-Dade Counties labor and employment market. The
preliminary unemployment labor total for May 2001 is 5.8 percent in
Miami-Dade
County. There are currently 1,082,288 employees in Miami-Dade’s labor
force (source:
Miami Market Index Brief, 2001).
The fastest growing occupations projected from 1997 to 2007 in
Miami-Dade and Monroe counties are those in the television and movie
industry
and computer engineers and specialists.
The fastest declining occupations are in food servers, bellhops
in
hotels, and airline occupations (mechanics, flight attendants pilots) (source:
Florida Department of Labor and Employment Security, Office of Labor
market
Statistics, 2001). The September 11th
terrorist attacks have added to the decline of the tourist related
occupations
in Florida. Occupations losing the most
jobs after this event include those in the food and hospitality
industries
(waiters/waitresses, cooks, bartenders, hotel receptionists).
Miami-Dade
is part of a larger regional economy and labor market that includes
Broward and
Palm Beach Counties. The regional
economy should include all economic activity that provides income and
employment for the residents of the community for which the study is
undertaken. The regional labor market
is important from a competitive advantage standpoint.
The availability of a skilled workforce has become an important
location factor for many businesses.
|
|
Civilian Labor Force |
Workers Employed |
||||
|
|
June 1998 |
June 1999 |
%Change |
June 1998 |
June 1999 |
%Change |
|
City |
180,863 |
183,684 |
+1.6 |
162,814 |
166,762 |
+2.4 |
|
MSA |
1,041,525 |
1,060,538 |
+1.8 |
969,523 |
993,032 |
+2.4 |
|
U.S. |
138,798,000 |
140,666,000 |
+1.3 |
132,265,000 |
134,395,000 |
+1.6 |
Source:
U.S. Bureau of Labor Statistics
|
|
Civilian Labor Force |
Unemployed/Rate |
||||
|
|
June 2000 |
June 2001 |
%Change |
June 2000 |
June 2001 |
%Change |
|
MSA |
1,062,622 |
1,096,470 |
+3.2 |
59,650/5.6 |
68,925/6.3 |
+.07 |
|
State |
7,539,055 |
7,820,352 |
+3.7 |
291,624/3.9 |
337,845/4.3 |
+.04 |
Source:
U.S. Bureau of Labor Statistics
|
|
1998 |
1999 |
||||||||||
|
|
Jul |
Aug |
Sept |
Oct |
Nov |
Dec |
Jan |
Feb |
Mar |
Apr |
May |
Jun |
|
City |
9.0 |
8.8 |
9.2 |
9.2 |
9.5 |
8.8 |
10.2 |
9.2 |
9.0 |
9.5 |
9.3 |
9.2 |
|
MSA |
6.2 |
6.1 |
6.4 |
6.4 |
6.6 |
6.1 |
7.1 |
6.3 |
6.2 |
6.6 |
6.4 |
6.4 |
|
U.S. |
4.7 |
4.5 |
4.4 |
4.2 |
4.1 |
4.0 |
4.8 |
4.7 |
4.4 |
4.1 |
4.0 |
4.5 |
Source: U.S. Bureau of
Labor Statistics
|
Occupations Expected to Have The Largest Job Growth |
Fast-Growing Occupations (ranked by percent growth) |
|
1. Cashiers |
1. Systems analysts |
|
2. Salespersons, retail |
2. Physical therapy assistants/aides |
|
3. General managers & top executives |
3. Desktop publishers |
|
4. Registered nurses |
4. Home health aides |
|
5. Waiters and waitresses |
5. Computer Engineers |
|
6. Marketing & sales, supervisors |
6. Medical assistants |
|
7. Janitors/cleaners/maids |
7. Physical Therapists |
|
8. General office clerks |
8. Paralegals |
|
9. Food preparation |
9. Emergency medical techs. |
|
10. Hand packers & packagers |
10. Occupational therapists |
Source: Florida
Department of Labor and Employment Security,
Division of Jobs and Benefits, Bureau of Labor Market Information.
|
NAICS
Description |
June 2000 |
May 2001 |
June 2001 |
|
Total Nonfarm |
1,020,000 |
1,039,800 |
1,042,200 |
|
Goods Producing |
107,500 |
106,100 |
106,300 |
|
Mining |
500 |
500 |
500 |
|
Construction |
37,800 |
38,200 |
38,5000 |
|
Manufacturing |
69,200 |
67,400 |
67,300 |
|
Durable Goods |
33,700 |
33,100 |
33,100 |
|
Furniture/Fixtures |
3,600 |
3,500 |
3,600 |
|
Fabricated Metal |
4,300 |
4,400 |
4,400 |
|
Mach & Elec. Eqp. |
6,300 |
5,900 |
5,800 |
|
Transportation Eqp. |
5,300 |
5,100 |
5,100 |
|
Non Durable Goods |
35,500 |
34,300 |
34,200 |
|
Food Products |
5,200 |
4,900 |
4,900 |
|
Apparel |
9,300 |
9,100 |
9,100 |
|
Printing/Publish. |
10,200 |
10,100 |
10,100 |
|
Service Producing |
912,500 |
933,700 |
935,900 |
|
Transportation/P.U. |
91,800 |
95,000 |
95,400 |
|
Trucking/Warehouse |
9,600 |
9,700 |
9,700 |
|
Transportation/Air |
32,800 |
34,200 |
34,400 |
|
Communications/Utilities |
22,800 |
23,800 |
24,000 |
|
Trade |
260,900 |
261,900 |
263,200 |
|
Wholesale Trade |
83,500 |
85,700 |
86,300 |
|
Retail Trade |
177,400 |
176,200 |
176,900 |
|
Building Materials/Garden
Supplies |
5,100 |
4,900 |
4,900 |
|
Gen. Merchandise |
16,600 |
16,700 |
16,700 |
|
Food Stores |
34,000 |
33,800 |
34,400 |
|
Auto Dealers |
15,900 |
15,700 |
15,800 |
|
Apparel/Access. |
14,400 |
14,400 |
14,400 |
|
Furniture & Equipment. |
9,500 |
9,100 |
9,100 |
|
Eating/Drinking |
56,500 |
56,100 |
56,100 |
|
Misc Retail |
25,400 |
25,500 |
25,500 |
|
Finance, Ins., Real Est. |
66,600 |
67,400 |
67,900 |
|
Depository Institutions |
18,500 |
18,700 |
18,800 |
|
Real Estate |
20,500 |
20,700 |
21,000 |
|
Services |
349,300 |
362,400 |
363,600 |
|
Hotels/Lodging |
22,400 |
24,400 |
24,000 |
|
Personal Services |
11,800 |
12,500 |
12,300 |
|
Business Services |
95,100 |
102,800 |
103,000 |
|
Amusement/Rec. |
11,700 |
10,900 |
11,100 |
|
Health Services |
82,500 |
83,000 |
83,600 |
|
Total Government |
143,900 |
147,000 |
145,800 |
|
Total Federal Govt. |
19,800 |
18,500 |
18,400 |
|
Total
State/Local |
124,100 |
128,500 |
127,400 |
|
Total State |
19,200 |
19,800 |
18,900 |
|
Total Local |
104,900 |
108,700 |
108,500 |
Source: Florida Department
of Labor and Employment Security,
Division of Jobs and Benefits, Bureau of Labor Market Information.
The
Census of Manufactures published by the U.S. Department of Commerce
serves as
the primary data source for the following analysis.
The U.S. Census of Manufactures State Report
(conducted at five year intervals on years ending in 7 and 2) contains
pertinent industry statistics such as: number of firms/establishments,
employment, payroll, value-added by manufacture, cost of materials
consumed,
and capital expenditures. Census data
is compiled at the state, metropolitan statistical area (MSA), county
and city
levels. The Census of Manufactures
covers all establishments with one paid employee or more primarily
engaged in
manufacturing as defined in the Standard
Industrial Classification (SIC) Manual (since 1997, SIC codes were
changed
to the North American Industrial Classification System - NAICS).
A
detailed analysis of manufacturing trends in the region and the State
of
Florida revealed several significant findings.
The electric and electronic equipment sector has made a
substantial contribution
to both the regional and state economy in terms of new firm formation
and
employment growth. However, in
assessing the full economic impact of a particular manufacturing sector
it is
also necessary to weigh such factors as: 1) payroll for production
workers, 2)
value-added by manufacturing, and 3) new capital expenditures. Value-added is considered to be the best
value measure available for comparing the relative economic importance
of
manufacturing among specific industrial sectors and defined geographic
areas.
|
Table 9: Historical Manufacturing Statistics for Miami, FL PMSA (1977-1997) |
|||||||||
|
|
Total Firms |
> than 20 Emp. |
Total Emp. (1000) |
Payroll (millions) |
Production Workers
(1000) |
Production Worker
Wages (millions) |
Value added by
Manufacturing (millions) |
New Capital
Expenditures (millions) |
Value of Shipments
(millions) |
|
1977 |
3,410 |
888 |
85.1 |
812.8 |
65.8 |
509.2 |
1797.5 |
112.3 |
3,546.0 |
|
1982 |
3,394 |
977 |
98.4 |
1,389.5 |
68.5 |
757.3 |
2,843.3 |
221.1 |
5,532.3 |
|
1987 |
3,395 |
941 |
89.3 |
1,568.4 |
62.2 |
880.1 |
3,561.9 |
132.0 |
6,734.4 |
|
1992 |
3,336 |
815 |
80.3 |
1,811.3 |
56.4 |
939.2 |
4,242.0 |
203.3 |
7,650.5 |
|
1997 |
3,031 |
663 |
66.3 |
1,663.7 |
48.5 |
954.4 |
4,855.9 |
228.2 |
8,523.9 |
Source: US
Census of
Manufactures, 1997
According
to the U.S. Census, the Miami Primary Statistical Metropolitan Area
(PMSA) has
experienced a steady decline in its overall manufacturing base. Miami-Dade shed nearly 19,000 manufacturing
jobs between 1977-1997. New growth
(1992-1997) in manufacturing establishments occurred in Fabricated
Metals, Food
Products, Furniture and Medical Instruments.
Significant job growth occurred only in Fabricated Metals and
Furniture
Production.
|
Table 10: Manufacturing Growth For Miami, FL PMSA (1992/1997) |
|||||||
|
Industry |
Total firms |
Total Emp. |
Payroll (millions) |
Production workers |
Value added by Mfg. |
New capital Expenditures |
Value of Shipments |
|
Fabricated Metal
Product Mfg |
219/254 |
4.8/6.0 |
107.3/147.6 |
3.6/4.6 |
197.9/332.9 |
8.7/13.1 |
385.3/574.4 |
|
Food Mfg. |
185/306 |
5.3/4.5 |
127.7/122.8 |
3.3/2.7 |
513.2/457.4 |
21.0/23.1 |
1,097.1/929.9 |
|
Furniture/ Related
product Mfg |
255/311 |
3.8/4.3 |
64.7/90.2 |
2.9/3.2 |
126.3/175.6 |
4.0/8.3 |
250.3/331.9 |
|
Medical
Equip./Supplies Mfg |
84/130 |
7.8/4.5 |
278.0/155.8 |
4.0/2.4 |
444.3/1,075.3 |
46.4/20.0 |
803.0/1,188.0 |
Source: US
Census of
Manufactures, 1997
Another manufacturing growth
sector that has emerged
at both the state and regional levels is medical instruments and
products. Enterprise Florida reports that
the medical
instruments and supplies sector is one of the fastest growing
industries in
Dade, Broward and Palm Beach Counties.
Improving wages, high value-added, and increased capital
expenditures
have made the medical instruments manufacturing sector a prime target
for
industry attraction marketing strategies.
Based on a 1997 study by SRI International, the Business
Development
Board of Palm Beach County has identified the
Medical/Pharmaceutical/Health
Care industry as one of their top four target clusters.
Industrial cluster strategies consider
recent growth trends and the projection or outlook for specific
industrial
sectors.
An
important economic growth indicator is employment projections within an
industry. The Florida Department of
Labor and Employment Security’s Bureau of Labor Market Information
published
countywide industry and occupational projections for the period
1995-2005. The following is a summary and
comparison of
industry and occupational projections for Dade, Broward, Palm Beach,
and Monroe
Counties:
|
Table 11: Manufacturing Employment Projections 1995-2005: Dade/Monroe Counties |
|||
|
Durables |
Non-durables |
||
|
Gain/Loss |
Gain/Loss
|
||
|
Instruments/Related
Products |
+36.5% |
Leather Products |
+10.6% |
|
|
|
Paper/Allied Products |
+8.1% |
|
|
|
Chemicals/Allied Products |
-20.6% |
|
|
|
Printing and Publishing |
-8.2% |
|
|
|
Apparel/Textiles |
-8.1% |
Source: Florida Department of Labor and
Employment
Security Division of Jobs and Benefits, Bureau of Labor Market
Information,
|
Table 12: Non-Manufacturing Employment Projections: Dade/Monroe Counties |
|
|
Sector |
Gain/Loss |
|
Agriculture Services |
+31.4% |
|
Services |
+26.0% |
|
Government |
+20.2% |
|
Wholesale/Retail Trade |
+19.9% |
|
Transportation |
+17.7% |
|
F.I.R.E |
+10.9% |
|
Construction |
+6.2% |
|
Agriculture Production |
-13.9% |
|
Mining |
-12.0% |
|
Table 13: Manufacturing Employment Projections: Broward County |
|||
|
Durables |
Non-durables |
||
|
Gain/Loss |
Gain/Loss |
||
|
Transportation Equipment |
+19.5% |
Chemicals & Allieds |
+15.5% |
|
Electronics |
+9.2% |
Petroleum Products |
+13.2% |
|
Fabricated Metal |
-7.5% |
Printing and Publishing |
-.2% |
|
Industrial Machinery |
-4.6% |
|
|
|
Table 14: Non-Manufacturing Employment Projections: Broward County |
|
|
Sector |
Gain/Loss |
|
Agriculture Services |
+31.4% |
|
Services |
+27.0% |
|
Government |
+21.6% |
|
Wholesale/Retail Trade |
+21.4% |
|
F.I.R.E |
+16.7% |
|
Transportation |
+14.9% |
|
Construction |
+6.1% |
|
Agriculture Production |
-13.8% |
|
Mining |
-9.9% |
|
Table 15: Manufacturing Employment Projections: Palm Beach County |
|||
|
Durables |
Non-durables |
||
|
Gain/Loss |
Gain/Loss
|
||
|
Instruments/Related
Products |
+24.1% |
Apparel/Textiles |
+38.5% |
|
Primary Metals |
+23.8% |
Rubber/Plastics |
+28.2% |
|
Industrial
Machinery/Equip. |
-39.1% |
Food Products |
+13.9% |
|
Electronics |
-4.5% |
Printing and Publishing |
+12.6% |
|
Table16: Non-Manufacturing Employment Projections: Palm Beach County |
|
|
Sector |
Gain/Loss |
|
Services |
+33.5% |
|
Agriculture Services |
+31.4% |
|
Wholesale/Retail Trade |
+25.6% |
|
Mining |
+27.7% |
|
Government |
+26.9% |
|
Transportation |
+16.7% |
|
F.I.R.E |
+14.1% |
|
Agriculture Production |
+8.5% |
|
Mining |
-13.9 |
The
79th Street Corridor study area is bounded by Northwest 22nd
Avenue to the east; East 10th Avenue to the west (City of
Hialeah);
Northwest 82nd Street to the north; and Northwest 79th
Street to south. The study area is
comprised of nearly all or a portion of four census tracts (see Figure
1). Data has been aggregated to include
census
tracts 6.05, 9.02, 9.03, and 10.03.
Although each census tract boundary extends slightly outside of
the 79th
Street Corridor study area, they are generally representative of the
more
defined area. All data presented in
this section was obtained from the US Census of Population and Housing
1990-2000. Comparative analysis of such
variables as population, housing tenure, and race/ethnicity was
performed for
each census tract and Miami-Dade as a whole.
The final section analyzes longitudinal change by comparing 1990
to 2000
US Census data. Demographic and housing
change over the past 10 years was calculated for two diverse areas of
the 79th
Street Corridor and for Miami-Dade County.
Figure
1: Census Tracts within the 79th Street Corridor Study Area
|
Table 17: Demographic Data: Tracts Representing 79th Street Target Area |
||||||||
|
|
9.02 |
9.03 |
6.05 |
10.03 |
||||
|
POPULATION |
# |
% |
# |
% |
# |
% |
# |
% |
|
Total
population |
6,937 |
100% |
3817 |
100% |
4721 |
100% |
5547 |
100% |
|
|
|
|
|
|
|
|
|
|
|
TOTAL HOUSEHOLDS |
1854 |
100% |
1226 |
100% |
1283 |
100% |
1814 |
100% |
|
Family households |
1530 |
82.5% |
877 |
71.5% |
1091 |
85.0% |
1279 |
70.5% |
|
Family house holds with children <18 |
623 |
33.6% |
384 |
31.3% |
383 |
29.9% |
512 |
28.2% |
|
Single females with children <18 |
173 |
9.3% |
118 |
9.6% |
49 |
3.8% |
235 |
13.0% |
|
Average household size |
3.63 |
|
3.05 |
|
3.64 |
|
3.06 |
|
|
Average family size |
3.82 |
|
3.56 |
|
3.66 |
|
3.63 |
|
|
|
|
|
|
|
|
|
|
|
|
HOUSING TENURE |
|
|
|
|
|
|
|
|
|
Occupied housing units |
1854 |
100% |
1226 |
100% |
1283 |
100% |
1814 |
100% |
|
Owner-0ccupied housing units |
1278 |
68.9% |
755 |
61.6% |
971 |
75.7% |
1,085 |
59.8% |
|
Renter-occupied housing units |
576 |
31.1% |
471 |
38.4% |
312 |
24.3% |
729 |
40.2% |
|
|
|
|
|
|
|
|
|
|
|
AGE |
|
|
|
|
|
|
|
|
|
Under 9 years |
908 |
13.1% |
536 |
14.0% |
482 |
10.2% |
824 |
14.9% |
|
10 to 19 years |
1077 |
15.5% |
619 |
16.2% |
549 |
11.6% |
973 |
17.5% |
|
20 to 34 years |
1454 |
21.0% |
728 |
19.1% |
960 |
20.3% |
1034 |
18.6% |
|
35 to 54 years |
1867 |
26.9% |
1095 |
28.7% |
1259 |
26.7% |
1423 |
25.7% |
|
55 to 64 years |
742 |
10.7% |
377 |
9.9% |
627 |
13.3% |
603 |
10.9% |
|
65 years or older |
889 |
12.8% |
462 |
12.1% |
844 |
17.9% |
690 |
12.4% |
|
|
|
|
|
|
|
|
|
|
|
RACE[1] |
|
|
|
|
|
|
|
|
|
White |
3,326 |
47.9% |
1,883 |
49.3% |
4356 |
92.3% |
572 |
10.3% |
|
Black or African American |
2,707 |
39% |
1,569 |
41.1% |
52 |
1.1% |
4704 |
84.8% |
|
American Indian/Alaskan |
24 |
0.3% |
10 |
0.3% |
0 |
0.0% |
11 |
0.2% |
|
Asian |
27 |
0.4% |
6 |
0.2% |
27 |
0.6% |
2 |
0.0% |
|
Native Hawaiian/Other Pacific Isl.
|
2 |
0% |
1 |
0% |
0 |
0.0% |
9 |
0.2% |
|
Other |
534 |
7.7% |
173 |
4.5% |
200 |
4.2% |
113 |
2.0% |
|
Two or more races |
317 |
4.6% |
175 |
4.6% |
86 |
1.8% |
136 |
2.5% |
|
|
|
|
|
|
|
|
|
|
|
HISPANIC/LATINO |
|
|
|
|
|
|
|
|
|
Total Hispanic/Latino (of any Race[2]) |
4,035 |
58.2% |
2,117 |
55.5% |
4294 |
91.0% |
741 |
13.4% |
|
Mexican |
50 |
0.7% |
41 |
1.1% |
65 |
1.4% |
26 |
0.5% |
|
Puerto Rican |
284 |
4.1% |
78 |
2% |
136 |
2.9% |
61 |
1.1% |
|
Cuban |
1,647 |
23.7% |
840 |
22% |
3398 |
72.0% |
136 |
2.5% |
|
Other Hispanic/Latino |
2,054 |
29.6% |
1,158 |
30.3% |
695 |
14.7% |
518 |
9.3% |
|
Not Hispanic/Latin |
2,902 |
41.8% |
1,700 |
44.5% |
427 |
9.0% |
4806 |
86.6% |
|
Total |
|
|
|
|
|
|
|
|
Source: US Census Profile of General
Demographic
Characteristics, 2000.
|
Table 18: Comparison of Demographic Data: 79th Street Area and Miami-Dade County |
||||
|
|
79th St. (All
Tracts) |
Miami-Dade
County |
||
|
POPULATION |
# |
% |
# |
% |
|
Total
population |
21,022 |
100% |
2,253,362 |
100% |
|
|
|
|
|
|
|
TOTAL HOUSEHOLDS |
6177 |
|
776,774 |
100% |
|
Family
households |
4777 |
77.3% |
548,493 |
70.6% |
|
Family households with children <18[3] |
1902 |
30.8% |
262,752 |
33.8% |
|
Single females with children <18 |
575 |
9.3% |
70,316 |
9.1% |
|
Average household size |
3.34 |
|
2.84 |
|
|
Average family size |
3.67 |
|
3.35 |
|
|
|
|
|
|
|
|
HOUSING TENURE |
|
|
|
|
|
Occupied housing units |
6177 |
100% |
776,774 |
100% |
|
Owner-0ccupied housing units |
4089 |
66.2% |
449,325 |
57.8% |
|
Renter-occupied housing units |
2088 |
33.8% |
327,449 |
42.2% |
|
|
|
|
|
|
|
AGE |
|
|
|
|
|
Under 9 years |
2750 |
13.1% |
303,623 |
13.5% |
|
10 to 19 years |
3218 |
15.3% |
315,743 |
14.0% |
|
20 to 34 years |
4176 |
19.9% |
482,154 |
21.4% |
|
35 to 54 years |
5644 |
26.8% |
644,732 |
28.6% |
|
55 to 64 years |
2349 |
11.2% |
206,558 |
9.2% |
|
65 years or older |
2885 |
13.7% |
300,552 |
13.3% |
|
|
|
|
|
|
|
RACE |
|
|
|
|
|
White |
10137 |
48.2% |
1,570,558 |
69.7% |
|
Black or African American |
9032 |
43.0% |
457,214 |
20.3% |
|
American Indian/Alaskan |
45 |
0.2% |
4,365 |
.2% |
|
Asian |
62 |
0.3% |
31,753 |
1.4% |
|
Native Hawaiian/Other Pacific Isl.
|
12 |
0.1% |
799 |
0.0% |
|
Other |
1020 |
4.9% |
103,251 |
4.6% |
|
Two or more races |
714 |
3.4% |
85,422 |
3.8% |
|
Total |
|
|
|
|
|
HISPANIC/LATINO |
|
|
|
|
|
Total Hispanic/Latino (of any
Race) |
11187 |
53.2% |
1,291,737 |
53.3% |
|
Mexican |
182 |
0.9% |
38,095 |
1.7% |
|
Puerto Rican |
559 |
2.7% |
80,327 |
3.6% |
|
Cuban |
6021 |
28.6% |
650,601 |
29% |
|
Other Hispanic/Latino |
4425 |
21.0% |
522,714 |
23% |
|
Not Hispanic/Latin |
9835 |
46.8% |
961,625 |
42.7% |
|
Total |
21,022 |
100% |
2,253,362 |
100% |
Source: US
Census Profile of General
Demographic Characteristics, 2000.
The
data in Table 17 represents general population statistics for the 79th
St. Corridor, delineated by census tract.
Table 18 shows the tabulation in relation to Miami-Dade County. The population of the four census tracts
together total 21,022. By delineating
the residential areas in and around the study area boundaries (see land
use map
in this report for residential areas), it is estimated that half
(approximately
10,500) the total population reside within the study area boundaries.
Referring
to tables 17 and 18, the 79th Street Corridor has some
characteristics that are proportionately similar and others that are
significantly different than those of Miami-Dade County.
The following bullet summary highlights some
of the key findings.
·
Family
households (or
simply “families”) in the 79th Street area are
proportionally higher
than MDC by 7%, but family households with children and single mother
households are similar to that of MDC.
Areas in and around the 79th Street corridor area
indicate a
slightly larger average household size (3.34 compared to 2.84 in MDC)
and
slightly larger household family size (3.67 compared to 3.35 in MDC).
·
Owner to
renter ratio is
higher in the 79th Street area than in MDC.
Homeownership is 66.2% in the 79th
Street area (33.8% renter households), while MDC’s homeownership is
57.8%
(42.2% renter households) approximately a 10% variation in
homeownership. However, the areas within
the 79th
Street area differ significantly in terms of household tenure,
especially when
comparing the Hialeah proportion in the western part of the study area
(with
more ownership) to the central section of the 79th Street
area (with
less ownership).
·
Age
distribution is proportionately
similar to MDC. However, the Hialeah
section of the 79th Street Corridor shows a considerably
higher
older population (31.2% are over 55 years of age) than both MDC and
other parts
of the 79th Street area.
·
The largest
discrepancy
in the demographic data involves racial composition (see racial/ethnic
demographic map on page 22). The 79th
Street target area has a significantly higher African American
population than
MDC. Racially, the 79th
Street area is half white and half black.
The Hispanic population is similar to that of MDC with both
about 53%
Hispanic. However, tracts within the 79th
Corridor area are racially segregated (see table 4).
While the Hialeah area (tract 6.05) shows
over 91% Hispanic and over 92% white (“Hispanic” and “Race” are not
mutually
exclusive), the more central and eastern tracts of the 79th
Street
area (10.03) show a Black population of 84.8% and a Hispanic population
of only
13.4%.
The following Table (19) shows demographic
changes
from 1990 to 2000. In sum, it shows
that population and housing tenure have increased only slightly. It is followed by Table 20 that illustrates
how these changes compare to MDC and among the target census tracts.
|
Table 19: Demographic Changes from 1990 to 2000: 79th Street Area Census |
|||||
|
|
1990 |
2000 |
%Change |
||
|
POPULATION |
# |
% |
# |
% |
|
|
Total
population |
20,888 |
100 |
21,022 |
100% |
+0.6% |
|
Total households |
6,103 |
|
6,177 |
|
+1.2% |
|
Family households |
4,753 |
77.9% |
4,777 |
77.3% |
+0.5% |
|
HOUSING TENURE |
|
|
|
|
|
|
Occupied housing units |
6,103 |
100% |
6,177 |
100% |
+1.2% |
|
Owner-occupied housing units |
4,050 |
66.4% |
4,089 |
66.2% |
+1.0% |
|
Renter-occupied housing units |
2,053 |
33.6% |
2,088 |
33.8% |
+1.7% |
|
RACE |
|
|
|
|
|
|
White |
9,695 |
46.4% |
10,137 |
48.2% |
+4.6% |
|
Black or African American |
9,568 |
45.8% |
9,032 |
43.0% |
-5.6% |
|
American Indian/Alaskan |
40 |
0.2% |
45 |
0.2% |
+12.5% |
|
Asian/Pacific Isl. |
85 |
0.4% |
74 |
0.4% |
-12.9% |
|
Other |
1,500 |
7.2% |
1,020 |
4.9% |
-32.4% |
|
Two or more races |
N/A |
|
714 |
3.4% |
|
|
Total |
20,888 |
100% |
21,022 |
100% |
+0.6% |
|
HISPANIC/LATINO |
|
|
|
|
|
|
Total Hispanic/Latino (of any Race) |
10,409 |
49.8% |
11,187 |
53.2% |
+7.5% |
Source:
US Census
Profile of General Demographic Characteristics, 1990 and 2000
|
|
Tracts 9.02 and 9.03 |
Tract 6.05 (Hialeah Section) |
Miami-Dade County |
||||||
|
|
1990 |
2000 |
% Change |
1990 |
2000 |
% Change |
1990 |
2000 |
% Change |
|
Population |
10,038 (100%) |
10,754 (100%) |
+7.1% |
407 (100%) |
4721 (100%) |
+16. % |
1,937,094 (100%) |
2,253,362 (100%) |
+16% |
|
Occupied housing units |
2,985 (100%) |
3,080 (100%) |
+3.2% |
1121 (100%) |
1283 (100%) |
+14.5% |
692,355 (100%) |
776,774 (100%) |
+12% |
|
Owner-
0ccupied housing units |
2,069 (69.3%) |
2,033 (66%) |
-1.7% |
910 (81.2%) |
971 (75.7%) |
+6.7% |
375,912 (54%) |
449,325 (58%) |
+19% |
|
Renter-occupied housing units |
916 (30.7%) |
1047 (34%) |
+14.3% |
211 (18.8%) |
312 (24.3%) |
+47.9% |
316,443 (46%) |
327,449 (42%) |
+. 03% |
Source: US Census 1990 and
2000
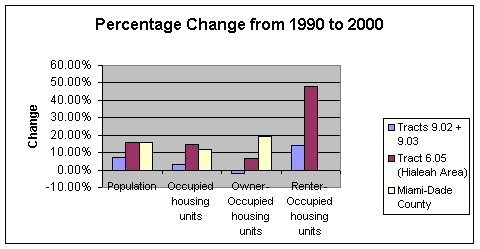
The following are the principal findings from
tables
19 and 20:
·
Overall, the
population
of the 79th Street area has increased only slightly. Population growth of 0.6% is minute compared
to MDC population growth of 16%. A
breakdown of the 79th Street sections demonstrate where
this growth
is occurring. The Hialeah section grew
at the same rate as MDC (16% from 1990 to 2000) indicating that it is
the
central and eastern sections of the 79th Street area that
are not
growing.
·
The study
area’s black
population has decreased, while the Hispanic population has increased.
·
The MDC
owner occupied
housing units have increased significantly (19% from 1990 to 2000), but
the 79th
Street area has increased its owner occupied housing units only
slightly (1%)
over this same 10-year period. A
breakdown of sections within the 79th Street area indicates
where
owner occupancy has increased/decreased.
·
The Hialeah
area (6.05
tract) has increased its owner occupied housing units by 6.7% and
increased
renter occupied units by 47.9%.
·
Conversely,
the central
section of the 79th Street area (tracts 9.02 and 9.03) has
decreased
in owner occupied housing units from 1990 to 2000 (-1.7%) and increased
its renter
occupied housing units (14.3%).
Figure
2 below illustrates this comparison:
|
|
Data for this
section was acquired from Claritas, Inc. Market Analysis Profile. The data set listed all existing businesses
in the 1999 calendar year along the three major commercial streets
within the
79th Street Corridor Study area according to SIC (Standard
Industrial Classification) Code and number of employees.
Business listings were verified by comparing
the aforementioned data to the 2000 Bressar’s Cross Reference
Directory
that lists business names by street address.
The data set
includes all businesses along the following streets:
The
businesses/establishments by SIC codes are detailed
below. The leading industrial sectors
in the 79th St. Corridor consist of businesses that are
small,
individually owned (or small franchise) retail and service industries,
located
predominately in one of the two large flea market malls in the area
(Flea
Market USA on 79th Street and Liberty Flee Market located
within the
Northside Shopping Center on the northwest corner of 79th
Street and
NW 27th Avenue).
Retail and
service industries comprise over half the total business establishments
in the
area. Others, such as manufacturing,
communications, agriculture, and construction are nearly non-existent,
representing less than 5 business establishments under each industrial
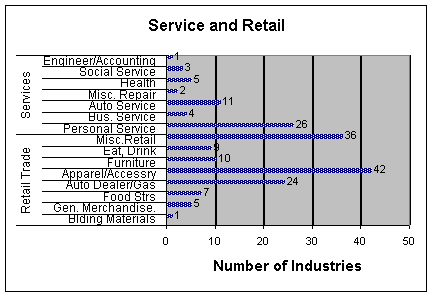
category. The graph and summary bullets
that follow profile the industry characteristics of the 79th
Street
Corridor study area.
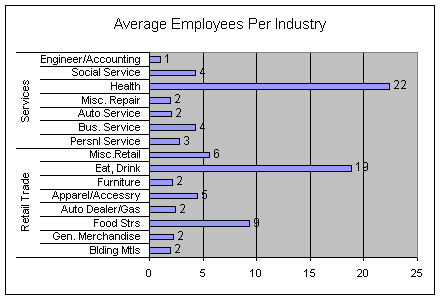
Table 21 and
the summary bullets that follow show the number of employees per
industry and
the mean average of employees per establishment in each industry.
|
|
Establishments |
Employees |
Employee
Mean |
||
|
|
# |
% |
# |
% |
|
Agr/Forestry/Fishing |
2 |
0.9 |
4 |
0.4 |
2 |
|
Mining |
0 |
0.0 |
0 |
0.0 |
0 |
|
Construction |
1 |
0.4 |
4 |
0.4 |
4 |
|
Manufacturing |
2 |
0.9 |
35 |
3.6 |
18 |
|
Transport./Communication |
5 |
2.2 |
5 |
0.5 |
1 |
|
Wholesale Trade |
13 |
5.8 |
71 |
7.3 |
5 |
|
Retail Trade |
134 |
59.3 |
518 |
53.3 |
3.9 |
|
Finance/Insurance/Real
Est. |
14 |
6.2 |
86 |
8.9 |
6.1 |
|
Services |
52 |
23.0 |
243 |
25.0 |
4.7 |
|
Public Administration |
3 |
1.3% |
5 |
0.5 |
2 |
|
TOTAL |
226 |
100 |
971 |
100 |
|
|
|
Establishments |
Employees |
Mean # of Employees
|
||
|
|
# |
% of total |
# |
% of total |
|
Retail
Trade
|
|||||
Building
Materials
|
1 |
0.4 |
2 |
0.2 |
2 |
|
General Merchandize |
5 |
2.2 |
11 |
1.1 |
2 |
|
Food Stores |
7 |
3.1 |
65 |
6.7 |
9 |
|
Auto Dealers/Gas |
24 |
10.6 |
59 |
6.1 |
2 |
|
Apparel/Accessory |
42 |
18.6 |
190 |
19.6 |
4.5 |
|
Furniture |
10 |
4.4 |
21 |
2.2 |
2.1 |
|
Restaurants |
9 |
4.0 |
170 |
17.5 |
19 |
|
Misc. Retail |
36 |
15.9 |
203 |
20.9 |
5.6 |
Service
|
|
|
|
|
|
|
Personal Service |
26 |
11.5 |
73 |
7.5 |
2.8 |
|
Bus. Service |
4 |
1.8 |
17 |
1.8 |
4 |
|
Auto Service |
11 |
4.9 |
23 |
2.4 |
2 |
|
Misc. Repair |
2 |
0.9 |
4 |
0.4 |
2 |
|
Health |
5 |
2.2 |
112 |
11.5 |
22 |
|
Social Service |
3 |
1.3 |
13 |
1.3 |
4 |
|
Eng./Acct./Research |
1 |
0.4 |
1 |
0.1 |
1 |
The property value table
below represents data from
realtor.com, which lists the current sale prices for residential
properties.
Current homes for sale within the 79th Street study area
boundaries
were compared to the neighboring City of Hialeah.
Table 23 below shows the significant differences between
residential properties for sale in the study area compared to Hialeah
to the
west. Mean and median price per square
foot are significantly higher in Hialeah than in the study area.
Source: Realtor.com,
November 2001
|
|
79th
Street Target Area |
Hialeah |
|
Range of
Total Price |
$35,000 to 14,000 |
$76,500 to 275,000 |
|
Mean $Price |
$77,746.77 |
$174,677.46 |
|
Median $Price |
$75,000 |
$169,500 |
|
Range of
Sq. Ft. |
492 to 1627 |
722 to 34 82 |
|
Mean Sq. Ft. |
998.58 |
1671.69 |
|
Median Sq. Ft. |
946.5 |
1565 |
|
Range $
Per Sq. Ft. |
$49.30 to 193.00 |
$39.57 to 171.15 |
|
Mean $ Per Sq. Ft. |
$81.11 |
$110.36 |
|
Median $ Per Sq. Ft. |
$73.00 |
$105.58 |
The
following
set of property value tables represent two overlapping areas:
properties of the
Extended Area include the 79th
Street Corridor study area plus an extension 3 blocks east/west and 4
blocks
north/south. The property values listed under 79th
Street Study
Area are only those properties within the target area (data in
tables 24
through 27 were obtained from the Miami-Dade County Property Appraisal
Records,
1999).
|
|
Extended Area |
79th Street
Target Area |
|
Range of Total Value: |
$5,000 to 6,500,000 |
$23,100 to 6,500,000 |
|
Range of Building Value |
$1,000 to 3,702,256 |
$3702.00 to $3,702,256 |
|
Mean Price Building: |
$168,873.59 |
$191,347 |
|
Median Price Building |
$76,397 |
$98,003 |
|
Range of Building Square
Foot |
240 to 610,824 |
240 to 610,824 |
|
Mean Square Foot: |
11,925 |
15,423 |
|
Price per Building Square
Foot Range: |
$.26 to 64.16 |
$.98 to $64.15 |
|
Mean Price per building
square foot: |
$23.96 |
$23.94 |
|
Median Price per building
square foot: |
$21.90 |
$21.76 |
Source:
Miami-Dade County Property Appraisal Records, 1999.
|
|
Extended Area |
79th Street
Target Area |
|
Total N |
5189 |
154 (9 missing) |
|
Range of Total $Value |
$10,258 to $567,140 |
$10,258 to $296,603 |
|
Range of Building $Value |
$510 to $401,765 |
$2,000 to 217,380 |
|
Mean $Price Building |
$41,452.12 |
$39,694.76 |
|
Median $Price Building |
$35,998 |
$35,134 |
|
Range of Building Square
Foot |
314 to 15,370 |
440 to 7150 |
|
Mean Building Square Foot |
1439.48 |
1442.81 |
|
$Price per Building
square foot range |
$0.53 to 52.54 |
$0.23 to 49.33 |
|
Mean $Price per Building
square foot |
$28.23 |
$27.12 |
|
Median $Price per
Building square foot |
$27.12 |
$25.95 |
Source:
Miami-Dade County Property Appraisal Records, 1999.
|
|
Extended Area |
79th Street
Target Area |
|
Total N |
479 |
204 |
|
Range of Total $Value |
$571 to $350,222 |
$1184 to $350,222 |
|
Mean $Price Land Value |
$19,277.53 |
$21985.47 |
|
Median $Price Land Value |
$9,969 |
$11,495 |
|
Range of Square Feet |
299.20 to 350222.00 |
545 to 350,222 |
|
Mean Vacant Land Square
Foot |
12,161.50 |
13,958.77 |
|
$Price per land square
foot range |
$0.11 to $1.78 |
$0.56 to 9. |
|
Mean Land $Price per
square foot |
$0.71 |
$2.20 |
|
Median Land $Price per
square foot |
$0.79 |
$1.26 |
Source:
Miami-Dade County Property Appraisal Records, 1999.
|
|
Extended Area |
79th Street
Target Area |
|
Total N |
329 |
184 |
|
Range of Total $Value |
$20,000 to $6,600,000 |
$31,052 to $2,341,083 |
|
Range of Building $Value |
$4,697 to $5,260,208 |
$4,697 to $1,904,458 |
|
Mean $Price Building |
$269,337.68 |
$169,794.169 |
|
Median $Price building |
$142,867 |
$116,531,00 |
|
Range of Building Square
Foot |
90 to 565,961 |
90 to 213,307 |
|
Mean Building Square Foot |
23,828.96 |
13,736.13 |
|
$Price per Building
square foot range |
$0.64 to $52.19 |
$0.64 to $52.19 |
|
Mean $Price per Building
square foot |
$13.35 |
$13.85 |
|
Median Price per Building
square foot |
$20.58 |
$13.63 |
Source: Miami-Dade County Property Appraisal Records, 1999.
The 79th Street
Corridor’s “planning prospectus”
recognized the redevelopment potential of the area.
The major commercial and industrial corridors including NW 79th
Street, NW 27th Avenue and the Amtrak/FEC right-of-ways are
grossly
underdeveloped. The 34.4-acre Northside Shopping Center and the 28-acre
Miami
Amtrak Station have been identified as potential redevelopment sites. An analysis of sizeable (1+
acre) commercial and industrial parcels
was performed for the economic study. A
total of 30 parcels were identified (see map on page 31 and Table 28 on
page
32) as part of the survey and economic market analysis.
Other significant parcels include the
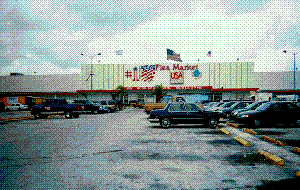
14.9-acre Flea Market USA located at 3017 NW 79th Street and
an
8.9-acre light industrial parcel located at 3500 NW 79th
Street. With the exception of the
Northside shopping center and Flea Market USA, most of the 1+ acre
parcels are
located either along the Amtrak or FEC right-of-ways and are zoned for
light or
heavy industry.
Miami-Dade’s
zoning is referenced under Chapter 33-Sections 33-1 to 33-405 and
promulgated
in accordance with the Local Government Comprehensive and Land
Development
Regulation Act, F.S. § 163.3161 et seq.
The
major business and commercial zoning districts within
the 79th Street Corridor study area are the Special Business
(BU-2)
and the Liberal Business (BU-3) Districts.
The Special Business District, also referred to as the Regional
Shopping
Center and Office Park District, has the stated purpose of “providing
for large
scale commercial and/or office facilities which serve the needs of
large urban
areas.” The BU-2 covers most of the
study area’s major commercial corridors including NW 79th
Street and
NW 27th Avenue. It includes
such major commercial land areas as the Northside Shopping Center,
Liberty Flea
Market and Flea Market USA. Residential
uses are permitted in BU-2 Districts subject to approval at a public
hearing. Maximum height of buildings is
not limited, but there exists a floor area ratio (FAR) of .40 at one
story and
increased by .11 for each additional story up to eight stories, and
thereafter
the FAR is increased by .06 for each additional story.
Total lot coverage permitted for all
buildings on the site cannot exceed 40 percent of the total lot area.
The Liberal Business BU-3 District
is located primarily along NW 27th Avenue south of NW 79th
Street and at several “spot” locations along 79th Street. The BU-3 permits uses with “serious
objectionable characteristics” such as adult book, video and
entertainment
establishments.
 The study
area’s principal industrial zoning are Industrial Light (IU-1)
Manufacturing
and Industrial Heavy (IU-2) Manufacturing Districts.
The IU-1 Districts are located adjacent to the Amtrak and FEC
railways. The IU-2 Districts are
primarily located along the FEC south of 75th Street. IU-1 Districts prohibit residential uses and
restrict business uses with the exception of restaurants, banks, office
buildings, hotels and motels. IU-2
Districts permit all uses in IU-2 Districts plus heavier industrial
uses such
as asphalt drum mixing plants, rock and sand yards, cement and clay
products,
sawmills and petroleum storage tanks.
The study
area’s principal industrial zoning are Industrial Light (IU-1)
Manufacturing
and Industrial Heavy (IU-2) Manufacturing Districts.
The IU-1 Districts are located adjacent to the Amtrak and FEC
railways. The IU-2 Districts are
primarily located along the FEC south of 75th Street. IU-1 Districts prohibit residential uses and
restrict business uses with the exception of restaurants, banks, office
buildings, hotels and motels. IU-2
Districts permit all uses in IU-2 Districts plus heavier industrial
uses such
as asphalt drum mixing plants, rock and sand yards, cement and clay
products,
sawmills and petroleum storage tanks.
Most of the study area’s residential
areas are zoned Single-Family (RU-1) and Two-Family (RU-2) Residential
Districts with several areas zoned for Four Unit (RU-3) Apartment
Houses. The residential districts are
pyramidal and
do not permit business uses.
It can be readily concluded from the
aforementioned assessment that the existing zoning within the 79th
Street Corridor study area does not provide the necessary planning
“tools” for
achieving the sustainable community redevelopment goals envisioned in
the 79th
Street Corridor Initiative’s planning prospectus.
79th Street Corridor Zoning and
Large Parcels Map
Table 28: Significant Commercial and industrial land Parcels
Parcel
table here
A
coherent pedestrian and vehicular circulation network is
fundamental to a strong community image.
Primary and secondary arterials that traverse the community
should
function as paths leading to key nodes of human activity.
As such, they should 1) serve to identify
the community, 2) possess aesthetic qualities, and 3) be designed to
accommodate pedestrian movement. The
challenge for the community is to harness its roadway capacity and
accessibility to maximize economic and social activity and to improve
its
overall image. In addition, if the 79th
Street Corridor is to aspire to the standards of a sustainable and
livable
community, it will require that walking, cycling, and public transit be
included as part of the overall master plan.
 The 79th
Street Corridor and its major
north/south arterials including NW 22nd, 27th and
32nd
Avenues are designed for high volume automobile traffic.
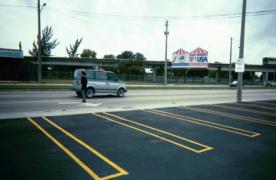
However, existing conditions throughout the
commercial corridors of the study area fail to support a
pedestrian-oriented
mixed-use redevelopment pattern. Little
correlation or harmony exists between the public right-of-ways and the
commercial properties that line the streets thus distorting the public
and
private realms.
The 79th
Street Corridor and its major
north/south arterials including NW 22nd, 27th and
32nd
Avenues are designed for high volume automobile traffic.
However, existing conditions throughout the
commercial corridors of the study area fail to support a
pedestrian-oriented
mixed-use redevelopment pattern. Little
correlation or harmony exists between the public right-of-ways and the
commercial properties that line the streets thus distorting the public
and
private realms.
Public infrastructure can
serve to unify dissimilar elements
and uses, provide coherence and rhythm to the streetscape, enhance
pedestrian
and vehicular circulation, establish order and manage development
design
strategy and serve public safety and health needs as well.
Within the grid system, the “block” is seen
as the critical component that defines the streetscape, the public
realm. It is
the public realm that one initially sees as one moves through the built
environment. The quality of this public
space that one sees first provides the most vivid impression. The private property is discerned at a
closer inspection. However, the public streets lack definition and
character. This is exacerbated by large
commercial properties with large paved parking lots and buildings set
back to
the rear of the properties. This also
creates a lack of definition between the paved areas and the sidewalks.
Intersections also need
to be safe and aesthetically pleasing. Landscape
architectural detailing including
median plantings, paver crosswalks and curbing can improve definition
and
public safety. Different tree types can
help demarcate edges between neighborhoods and major intersections and
changes
in use. They also provide shade and
civic beauty and can improve street and sidewalk definition.
Most of the study area
experiences chronic flooding and
ponding that will necessitate drainage and storm water collection and
retention. This situation is exacerbated
by large 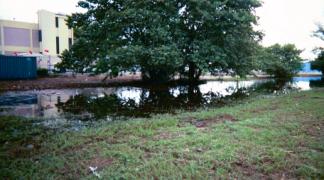 impervious areas such as
wide streets and parking lots that
create substantial sheet run-off during storm events.
Conventional storm drainage techniques utilizing standard
collection and piped distribution systems may be implemented along
certain
streets. However, a district-wide
drainage system should be planned and developed in combination with
alternative
techniques for storm water collection and percolation.
One method would include the use of
permeable pavements and treatments at vehicular use and storage areas
and along
pedestrian paths. Permeable surfaces
would additionally conserve land that would otherwise be dedicated to
paved
areas and combine pervious surface environmental considerations with
other
functional uses of the built environment.
impervious areas such as
wide streets and parking lots that
create substantial sheet run-off during storm events.
Conventional storm drainage techniques utilizing standard
collection and piped distribution systems may be implemented along
certain
streets. However, a district-wide
drainage system should be planned and developed in combination with
alternative
techniques for storm water collection and percolation.
One method would include the use of
permeable pavements and treatments at vehicular use and storage areas
and along
pedestrian paths. Permeable surfaces
would additionally conserve land that would otherwise be dedicated to
paved
areas and combine pervious surface environmental considerations with
other
functional uses of the built environment.
Existing street
conditions strongly suggest the need to
target public infrastructure improvements to the study area to help
stimulate
private investment activity.
An
exterior housing conditions survey was conducted to assess the general
physical
conditions of 79th Street Corridor’s housing stock. It is important to assess the overall
housing conditions of a neighborhood to determine appropriate housing
programs
and funding resources. The FIU/MC utilized
the Dallas Windshield Survey in assessing a 16-block area of
predominantly single-family homes north of 79th Street (see
land use
map in this report). Observations of
specific housing conditions were coded.
The components of the survey included roofs, siding, windows,
doors,
porches, foundations, driveways, and landscaping. Each
was assigned an ordinal code from 1 to 4 as defined below
(see appendix for detailed definitions of housing condition categories).
1=standard
2=standard-minor
repairs
3=substandard-major
repairs
4=dilapidated
The codes were then
tabulated into
averages per housing characteristic and by block. The
observations are presented in Table 29, which lists the
results by block and individual condition code. The
following is a summary of the findings:
·
The area closest to
“dilapidated” is Northwest 80th Street
on the 22nd block. The worst aspect of
these homes was the roof, which appeared to be crumbling with visible
evidence
of structural damage. Landscaping,
which offers little potential due to the small size of the lots, was
severely
overgrown and junk (automobile parts, old appliances) was scattered on
some of
these lawns. Several porches were also
dilapidated, while others were crumbling and cracking.
·
The area closest to
“standard” was Northwest 82nd Street
33rd block. In contrast to some of the
more substandard homes, these homes had stronger, barrel tile roofs
that
appeared to have no visual signs of disrepair.
Landscaping was slightly more complex (neater foliage), but
still not
especially elaborate. One of the
features of these homes was that they were the few surrounded by black
wrought
iron fences. Overall most homes were
surrounded by wire fence in disrepair.
·
The 3 most dilapidated
features are (in order starting with
most dilapidated) roofs, porches and driveways.
·
The 3 least dilapidated
are (in order starting with least
dilapidated) doors, foundation, and windows.
·
At least 7 vacant lots,
some overgrown with shrubs, were
observed among the homes.
|
|
Roofs/Eaves |
Siding |
Windows |
Doors |
Porches |
Foundations |
Driveway |
Landscaping |
Total |
Avg. Condition |
|
NW 80th Street/22nd block |
3.3 |
2.0 |
2.3 |
2.6 |
2.9 |
2.7 |
2.7 |
2.9 |
21.3 |
2.7 |
|
NW 80th Street/23rd block |
2.2 |
2.1 |
2.3 |
2.3 |
2.2 |
2.1 |
2.2 |
2.1 |
17.5 |
2.2 |
|
NW 81st Street/23rd block |
2.6 |
2.2 |
2.5 |
2.5 |
2.6 |
2.3 |
2.5 |
2.5 |
19.7 |
2.5 |
|
NW 81st. Street/ 22nd
block |
2.4 |
2.2 |
2.5 |
2.3 |
2.4 |
2.2 |
2.4 |
2.4 |
18.8 |
2.3 |
|
NW 81st. Terr./31st block |
2.2 |
2.1 |
2.2 |
2.0 |
2.3 |
2.1 |
2.3 |
2.2 |
17.4 |
2.2 |
|
NW 81st Terr./30th block |
2.1 |
2.3 |
2.2 |
2.2 |
2.3 |
2.1 |
2.1 |
2.3 |
17.6 |
2.2 |
|
NW 81st Terr./32nd block |
2.6 |
2.2 |
2.4 |
2.1 |
2.2 |
2.0 |
2.0 |
1.9 |
17.4 |
2.2 |
|
NW 81st Terr./33rd block |
2.0 |
2.0 |
1.8 |
1.7 |
1.8 |
1.8 |
1.8 |
1.8 |
14.7 |
1.9 |
|
NW 81st Terr./34th block |
2.4 |
2.3 |
2.3 |
1.9 |
2.5 |
2.0 |
2.3 |
2.4 |
18.1 |
2.3 |
|
NW 81st Terr./35th block |
2.4 |
1.6 |
1.6 |
1.6 |
1.6 |
1.6 |
1.8 |
1.7 |
13.9 |
1.6 |
|
NW 82nd St./35th block |
2.6 |
2.5 |
2.2 |
2.2 |
2.3 |
2.4 |
2.5 |
2.2 |
18.9 |
2.4 |
|
NW 82nd St./34th block |
2.7 |
2.3 |
2.2 |
2.2 |
2.5 |
2.5 |
2.6 |
2.5 |
19.5 |
2.4 |
|
NW 82nd St./33rd block |
2.3 |
2.1 |
2.3 |
2.0 |
2.0 |
2.0 |
2.0 |
2.0 |
16.7 |
2.1 |
|
NW 82nd St./32nd block |
2.4 |
2.1 |
2.1 |
2.1 |
2.4 |
2.1 |
2.1 |
2.1 |
17.4 |
2.2 |
|
NW 82nd St./31st. Block |
2.6 |
2.5 |
2.4 |
2.4 |
2.4 |
2.3 |
2.4 |
2.1 |
19.1 |
2.4 |
|
NW 82nd St./30th block |
2.6 |
2.1 |
2.1 |
2.2 |
2.4 |
2.2 |
2.4 |
2.4 |
18.4 |
2.3 |
|
39.4 |
34.6 |
35.4 |
34.3 |
36.8 |
34.4 |
36.1 |
35.5 |
286.4 |
35.9 |
|
|
Average |
2.5 |
2.2 |
2.2 |
2.1 |
2.3 |
2.2 |
2.3 |
2.2 |
17.9 |
2.2 |
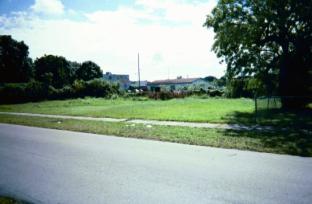
An example of the many
vacant parcels noted in the
windshield survey.
The
business survey was developed over the course of several weeks by a
group of researchers
at the FIU Metropolitan Center. It was
designed to conceptualize three critical questions pertaining to
business in
the 79th Street Corridor community (see appendix for survey
instrument):
Quota
sampling was used for selection from the total population of businesses
located
in the same areas as our industrial analysis.
The sample of 22 respondents in our study represents the
business
population of over 300 establishments on NW 79th Street, NW
27th
Avenue, and NW 36th Avenue in terms of type of industry. All surveys were conducted face-to-face,
during weekday business hours, and took anywhere from 15 to 45 minutes
per
survey. Survey respondents were either
managers or owners. A profile of these
respondents is shown below:
Location of Respondents’
Businesses:
§
11 located in the
Northside Shopping Center
§
7 located along the
79th Street Corridor
§
4 located in the Flea
Market USA
Types of Business:
§
10 Service
§
12 Retail
§
2 subsidiary of
corporation
§
2 headquarter of
corporation
§
7 family business
§
11 self-owned
Years at Location:
§
Range is from 4
months (the newest) to over 41 years (oldest)
Survey Question: “Over the past year, has your revenue increased, decreased, or stayed the same?”
Most
respondents said that their business revenue has decreased over the
past year
and most attribute this to the overall downslide of the national
economy. Those in the Northside Shopping
Center
especially expressed a concern about the rapid decrease in business
over the
past year. At least two said they are
even considering closing their business due to declining sales.
The
following table shows the respondents’ answers about business revenue
cross-tablulated with business location in the 79th Street
Corridor.
|
|
Decreased |
Stayed the Same |
Increased |
total |
|
Northside Shopping Center |
6 |
3 |
2 |
11 |
|
79th Street |
2 |
3 |
2 |
7 |
|
Flea Market USA |
3 |
0 |
0 |
3 |
|
total |
11 |
6 |
3 |
20 |
*1
businesses = N/A (not in location
long enough for comparison)
Survey
Question: “Approximately what percentage of
your clientele/customers are from this neighborhood?”
The
survey asked our respondents to give an approximate percentage of their
clientele that is local (from the neighborhood within a two mile
radius). Most all respondents said they
depend on
local clientele for business. Fifteen
respondents said that over 75 percent of their clientele was local and
all but
2 respondents said at least 50 percent was local. The remaining two
respondents, both owners of automotive businesses along 79th
Street
near the metro rail station, said that 50 percent of their clientele
lived
locally.
|
75% and over |
15 |
|
50% to 74% |
5 |
|
25% to 49% |
1 |
|
Less than
25% |
1 |
Respondents
depend on local customers and concentrate most of their energy serving
them,
rather than trying to attract an outside clientele.
They are skeptical about attracting outside clientele for two
reasons: First, they do not believe that outsiders would come into
their
neighborhood, because of the poor reputation it has (a perception
brought up
while asking them about crime in the 79th Street corridor
area). For example, when asked about
crime one respondent said, “We have a problem with crime here, but no
more than
other shopping centers. People who do
not live in this area think it is worse than it really is so they don’t
want to
come here.” Second, the respondents
believe that it is locals who have stayed loyal to them.
Respondents assert they have a ‘niche’ in
that they provide unique services and products that appeal to the 79th
Street neighborhood clientele, things one cannot find elsewhere. These include services/products for African
American men and women, (e.g., makeup products for dark-skinned women,
hair
salons that cater to African Americans).
One
owner, who sells watches from a small stand in the Flea Market USA
stated,
“Look around! You can’t find this stuff in, say, Burdines or Kmart or
any other
large retail chain. We have specialty things.”
Another, respondent, a Korean women who owns a beauty supply
store in
this same flea market said, “You really have to know the community to
run a
business here. That is the most
important thing. Not just anyone can come here and run a business.” Similarly, an owner of a nail
salon said
that over the years she has gotten to know the women in the
neighborhood and
now they come to her for advice and personal counseling.
“There are women in this neighborhood who
have problems. They come to me for
guidance,”
the owner said. The many nail and beauty salons in the target area act
as more
than beauty services. They are places
where local women and men can congregate and socialize.
A
nail salon manager said that the local clientele is so dedicated to the
shops
in the Northside Shopping Center that even when they move out of the
neighborhood,
they continue to come back. “This
shopping center is a hang-out. Janet (he points to a young woman who
was
getting her nails done during the interview) just moved to Coral
Gables, but
she’s been coming here for years and her friends are here.”
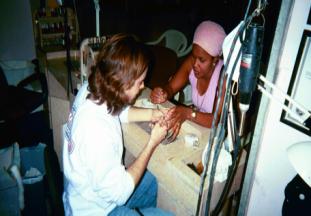
A customer gets her nails done at one of the
many nail
salons in the Northside Shopping Center.
Survey
Question: “What type of business skills
training would benefit your business?”
To
many of the respondents, business skills training is not in high demand. As one owner put it, “No one from the
outside can tell me about my business.
I know it better than anyone. I
know the customers.” Furthermore, many
owners/managers do not perceive of any benefits in learning more
technical
skills. Businesses in this target area
are small with few employees and
require little technical assistance by way of computers and Internet.
Only 8 of
the respondents have a 4-year college degree.
Half have a technical or 2-year degree, 2 respondents say their
highest
degree is a high school diploma and one respondent is a high school
dropout. The highest level of education
of their employees fares less. Of those
who have employees (16 businesses of the 22), only one said they have
employees
with a 4-year college degree. Seven
respondents said that most of their employees have a technical or
2-year degree
as the highest level of education and the rest said their employees
have no
more than a high school degree.
Some respondents said that they would be very
interested in learning
about what external help is available to them, such as business support
organizations/associations in Miami.
Respondents also expressed an interest in acquiring skills for
obtaining
loans, getting tax breaks or “anything that could increase my profit!”
as one
put it. The figure below shows the
level of interest respondents have in acquiring particular skills that
would
benefit their business. The figure
shows the results of a question asking about the level of interest of
particular skill training with an ordinal answer choice: no interest,
some
interest, or no interest at all. Figure
5 below shows results of a scale devised by calculating all responses
as: 0=no
interest; 1=some interest; 2=no interest at all.
Survey Question: “Have
you heard of or used any business
organizations that may help your business?”
To
understand the level of knowledge and utilization of business support
organizations by local business owners and managers, we read from a
list of
local organizations that support businesses such as Community
Development
Organizations (CDCs), WAGES Coalition, and Tools for Change. The respondents were first asked if they
have ever heard of the organization
and, subsequently, if they have ever used
the organization. We also asked that
they tell use the name of any outside help they receive.
The results are presented in Figure 6 using
calculations: “no”=0 and “yes”=1.
Figure 6 shows the frequency of respondents that have heard of the organization and used the
organization.
According
to our survey most businesses are not aware of, and very few of them
use, any
business organization/association that could possibly provide
assistance. The business support
organization on our
list that was recognized most was the Better Business Bureau. Although most have heard of
this entity (16), only 3 have utilized the BBB’s
resources, but only minimally. One
business owner said, “I didn’t get anything out of it (using BBB). They take my $150.00 and I get a certificate
from them.” Another organization that
was utilized was WAGES Coalition and Tools for Change.
‘Advantage Uniform’ on NW 79th
Street sells work uniforms to WAGES workers in exchange for tax breaks. Also, AV Insurance on NW 27th
Avenue near NW 79th Street offers WAGES workers a lower
insurance
cost in return for tax breaks. Those
who used Tools for Change said that the organization assisted them with
paperwork when they were starting their business.
Survey Question: “How
would you
rate various aspects of your community for business?”
Small businesses along 79th Street (not
including the flea market) have
a problem with parking. The flea
markets (Liberty and Flea Market USA) do not have this problem since
there is a
large parking lot in front—although one business owner in the Liberty
Flea
Market said this was inadequate for the general customer traffic the
market
receives during the weekends.
Crime is high according to these business owners. The biggest concern is theft, although 2 said shootings/drugs were a problem. However, they are confident that police patrol is good in the area. There is a police sub-station nearby and there are security guards in the flea markets.
The
respondents were also asked about the availability of good locations in
area
for business. Most said that finding
a good location for business was
difficult because there simply are not available spaces.
Some felt especially lucky to be at the
location they were in. For
example “Joe,” the owner of an auto broker right off of NW 79th
Street feels positive about his business’s future because of the area
he is in:
Clean streets and neighborhood appearance were of considerable concern to the respondents. In the Northside Shopping Center business owners complained about the upkeep of the building and surrounding area. Three respondents blamed the managers of the building for the poor conditions.
Figure
7 lists the conditions of the business community from best to worst. Table 31 shows the respondents’ main reasons
for choosing their business location within the 79th Street Corridor. In sum, most cited convenience of location
and large amount of customer traffic as the reasons for choosing this
particular location.
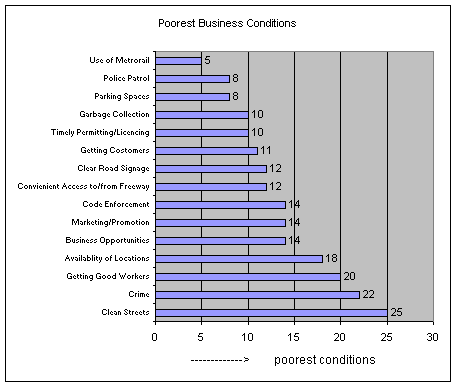
|
Reason |
Frequency |
|
Low Tax Rate |
0 |
|
Need of Business in Area |
4 |
|
Low Rent |
2 |
|
Convenient Location |
13 |
|
Large Amount of Customer
Traffic |
12 |
Convenient Location and
Large Amount of Customer
Traffic are similar according to respondents. When asked what they felt
was so
convenient about the location the respondents answered, “This is a
major
shopping area...a lot of customer traffic.”
This
section identifies and summarizes the principal funding mechanisms for
the 79th
Street Corridor Neighborhood Initiative.
These funding mechanisms are currently available in Miami-Dade
but will
need to be directly targeted and applied to the Corridor’s
redevelopment
proposals.
1. Community Development
Block Grant (CDBG) Program
For over 25 years, HUD's Community
Development Block Grant Program has
provided a comprehensive and flexible source of funding to address
local
housing, economic and community development needs.
Best practice case studies have shown that CDBG funds are most
effective when leveraged with private capital resources.
It is also important that CDBG resources be
targeted to clearly defined neighborhood areas.
Eligible activities:
The
statute and regulations authorize the use of CDBG funds by a grantee or
a
public
or private nonprofit entity to acquire real property by purchase ,
long-term
lease
or donation. Real property to be
acquired includes land, air rights, easements, right-of-ways and
buildings. Costs that may be paid for
with CDBG funds include the costs of surveys, appraisals, the
preparation of
legal documents, recordation fees, and other costs that are necessary
to effect
the acquisition. CDBG funds may also be
used to cover certain property management and disposition costs.
From
an economic development standpoint, the acquisition of real property
must meet
a national objective of the CDBG program.
To meet the national objective of "creating low and moderate
income
jobs" the acquisition would qualify if the property is to be used for
an
economic development project that will create or retain permanent jobs
at least
51 percent of which will benefit L/M income persons.
An example would be acquiring vacant property that is planned to
be used for a commercial purpose, and will be made available for that
purpose,
only if the business commits to provide at least 51 percent of the new
permanent jobs that will be created to L/M income persons.
To meet the national objective of
"removing a slum or blighted area" the acquired property must be used
in a manner that addresses one or more of the conditions that
contributed to
the deterioration of the area. An
example would be the use of CDBG funds to acquire several deteriorated
buildings located in a slum/blighted area for rehabilitation or
demolition.
CDBG
funds may be used by the grantee or other public or private nonprofit
entities
for the acquisition, construction, reconstruction, rehabilitation or
installation of public improvements or facilities (except for buildings
for the
general conduct of government).
Neither
the statute nor the regulations define the terms "public facilities"
or "public improvements."
However, in the CDBG program these terms are broadly interpreted
to
include all improvements and facilities that are either publicly owned
or that
are traditionally provided by the government, or owned by a nonprofit,
and
operated so as to be open to the general public. This
would include neighborhood facilities, firehouses, public
schools and libraries. Public
improvements include streets, sidewalks, curbs and gutters, parks,
playgrounds,
water and sewer lines, flood and drainage improvements, parking lots,
utility lines, and aesthetic amenities on public property such as
trees,
sculptures, pools of water and fountains, and other works of art.
CDBG
funds may be used to finance the costs
of rehabilitation including: residential property, whether privately or
publicly
owned, and commercial/industrial property, but where such property is
owned by
a for-profit, rehabilitation under this category is limited to exterior
improvements of the buildings and the correction of code violations
(Further
improvements for such buildings may qualify under the category of
Special
Economic Development Activities).
Eligible
types of assistance includes the costs
of labor, materials, supplies and other expenses required for the
rehabilitation of property; the financing
of grants, loans, loan guarantees, interest supplements and other forms
of
financial assistance; and the refinancing
of loans for existing indebtedness secured by a property being
rehabilitated with CDBG funds.
As
a consequence of changes to the CDBG program legislation in 1992,
significant
alterations were made to the program regulations to facilitate the use
of CDBG
funds for economic development purposes, both in terms of eligibility
and
national objectives. An economic
development project in the CDBG
program may be supported by a range of CDBG-funded activities,
including both
special economic development activities and other categories of basic
eligibility, each of which must meet a national objective of the CDBG
program.
CDBG
funds may be used for the following special
economic development activities:
Ø
Commercial or
industrial improvements carries out by the grantee
or
a nonprofit sub-recipient,
including:
¨ acquisition
¨ construction
¨ rehabilitation
¨ reconstruction, or
¨ installation of
commercial buildings or structures
and other related real property equipment
and improvements
Ø
Assistance to private
for-profit entities for an
activity determined by
the
grantee to be appropriate to carry out an economic development
project.
This assistance may include, but is not
limited to:
¨ grants
¨ loans
¨ loan guarantees
¨ technical assistance, or
¨ any other form except
for those specifically described as
ineligible
Examples
of special economic development activities include: a low interest loan to a business as an inducement to locate a
branch store in a redeveloping blighted area; financial assistance to a
business to demolish a decayed structure it owns in order to assist the
business
in constructing a new building on the site; and financial assistance to a manufacturer
for the expansion of its facilities which is expected to create
permanent jobs,
at least 51 percent of which will be taken by L/M income persons.
Grantees
and their sub-recipients may provide CDBG financial assistance to low-
and
moderate-income households to assist them in the purchase of a home. Specific purposes for which CDBG funds may
be provided include:
Ø
Subsidized interest
rates and mortgage principal amounts, including
making
a grant to reduce the effective interest rate on the amount
needed
by the purchaser to an affordable level.
Alternatively, the
grantee/sub-recipient
could make a subordinate loan for part of the
purchase
price, at little or no interest, for an amount of payments on
which,
together with that required under the first mortgage, would be
affordable to
the purchaser.
Ø
Financing the cost of
acquiring property already occupied by the
household at terms needed
to make the purchase affordable.
Ø
Paying all or part of
the premium (on behalf of the purchaser) for
mortgage insurance
required up-front by a private mortgagee.
Ø
Paying any or all of
the reasonable closing costs associated with the
home purchase on behalf
of the purchaser.
Ø
Paying up to 50
percent of the down payment required by the
mortgagee
for the purchase on behalf of the purchaser.
Homeowner
assistance may also be eligible under the categories of Public Services
or
Special Activities by CBDOs. While
these categories don't have the same restrictions on the type of
assistance
that may be provided, they do have to comply with the public services
cap.
In
the case where HUD has approved a Neighborhood Revitalization Strategy
(NRS)
and the grantee plans to provide homeownership assistance pursuant to
that
strategy, two further considerations should be given.
First, if the grantee elects to use a CBDO to deliver services
in
the strategy area, any services provided by the CBDO (including
homeownership
assistance) would be exempt from the expenditures cap on Public
Services. Second, where CDBG funds are
provided to non
L/M income households in a NRS area, meeting the L/M Income Benefit
national
objective is made feasible by a special feature offered by an NRS. All housing units assisted in such an area
may be considered
to be part of a single structure for the purpose
of meeting the 51 percent occupancy requirement.
Almost any community that
receives
CDBG funds has more community and economic development needs than it
can
possibly address with the amount of CDBG funds it receives through its
annual
entitlement grant. Therefore, a growing
number of communities have taken advantage of certain leveraging
approaches to
get the maximum impact from the CDBG resources they receive. These options make it possible to fund
special opportunities that may arise out of the normal planning cycle
or when a
high cost activity cannot be achieved with funds currently available. One such option, Section 108 Loan
Guarantees, provides
HUD the authority to pledge full faith and credit of the U.S.
Government as a
means of guaranteeing loans under the CDBG program.
Under this provision, a grantee may request loan guarantee
assistance
under the following conditions:
¨ The proceeds from loans
guaranteed under this provision may
be used
only for activities specifically eligible under Section 108,
which may
include many of the same activities that other CDBG funds may
assist;
¨
The grantee must pledge its future grants under the CDBG program as
security for the loans, and
¨ Additional security will
also be required for repayment of
the loans,
with the specifics determined on a case-by-case basis.
Features:
¨ A grantee may borrow
up to five times its annual grant under this
authority. (This means that, at
any one time, a grantee may have
outstanding guaranteed loans that total as much as five times the
the grantee's most recent annual grant amount).
¨ The loan repayment
period can be as long as 20 years.
¨ While Section 108 is
taxable borrowing, the interest rate
on the
loans typically do not exceed the usual Treasury borrowing rates
by more than 15 to
20 basis points. (Note:
there are restrictions
on mixing Section 108 loan guarantee assistance and tax exempt
borrowing).
¨ While most guaranteed
loans are repaid using an income
stream from
the activity assisted by the loan proceeds, CDBG grant funds
(and
program
income) can be
used to make interest and principal payments on the loans.
Many communities have applied Section 108 loan guarantees for business development. The HUD website under Blue Ribbon Practices on Community Development provides numerous examples of the diverse ways to use Section 108 loan guarantees for small business development. Middletown, Connecticut, Springfield Missouri, Wilmington, North Carolina and Warren, Ohio represent best practice examples of communities using Section 108 loans for micro-enterprise development and finance. Low-interest loans and gap financing are offered to small businesses that had been turned down by conventional lenders on condition that they hire lower-income residents. In the City of Wilmington, NC, Section 108 funding allowed the city to consolidate all of its economic development loan programs under a single entity, which allowed them to improve efficiency and effectiveness and reduce program costs. The Local Initiatives Support Coalition (LISC) in Kalamazoo, Michigan has utilized Section 108 loans to assist new homeowners with the required down payment by creating first and second mortgages.
3.
Tax Increment Financing
A. Program Description
Tax
Increment Financing (TIF) utilizes the incremental increase in ad
valorem tax
revenue within a designated geographic area to finance redevelopment
projects
within that area. As property values
rise above an established aggregate valuation (the "frozen" tax
base), tax increment is generated by applying the millage rate to that
increase
in value and depositing in a trust fund an amount equal to such
increased tax
revenue. The trust fund is the source
for repayment of indebtedness.
Florida
redevelopment activities are initiated by the governing body of a city
or
county adopting a resolution finding the existence of one or more slum
or
blighted areas or a shortage of housing affordable to low or moderate
income
persons within its jurisdiction. The
resolution must also find that the "rehabilitation, conservation, or
redevelopment, or a combination thereof," of the area is necessary. The governing body must further find the
need for a community redevelopment agency
("CRA")
to function within that local government's boundaries to carry out the
purposes
of the Redevelopment Act. The governing
body by resolution may designate itself as the CRA, create a separate
CRA by
ordinance, or designate a pre-existing downtown development entity. The next step in the redevelopment process
is to prepare a plan for redevelopment within the designated slum or
blighted
area (referred to as a "community redevelopment area").
The
community redevelopment plan, in
accordance with Chapter 163 S.
362, shall include the following contents:
1)
A legal description of
the boundaries of the community
redevelopment
area
and the reasons for establishing such boundaries shown in the plan.
2)
Show by diagram and in
general terms:
a)
the approximate amount of
open space to be provided
and
the street layout.
b)
limitations on the type,
size, height, number,
and
proposed use of buildings.
c)
the approximate number of
dwelling units.
d)
Such property as intended
for use as public parks,
recreation
areas,
streets, public utilities, and public improvements of
any
nature.
3)
If the redevelopment area
contains low or moderate income
housing, contain a neighborhood impact element which describes in
detail the
impact of the redevelopment upon the residents of the redevelopment
area and
the surrounding areas in terms of relocation, traffic circulation,
environmental quality, availability of community facilities and
services, effect
on school population, and other matters affecting the physical and
social
quality of the neighborhood.
4)
Identify specifically any
publicly funded capital projects
to be undertaken
within the community
redevelopment area.
5)
Contain adequate
safeguards that the work of redevelopment
will be carried out pursuant to the plan.
6)
Provide for the retention
of controls and the establishment
of any restrictions or covenants running with land sold or leased for
private
use for such periods of time and under such conditions as the governing
body
deems necessary to effectuate the purposes of this part.
7)
Provide assurances that
there will be replacement housing
for the relocation of persons temporarily or permanently displaced from
housing
facilities within the community redevelopment area.
8)
Provide an element of
residential use in the redevelopment
area if such use exists in the area prior to the adoption of the plan
or if the
plan is intended to remedy a shortage of housing affordable to
residents of low
or moderate income or if the plan is not intended to remedy such
shortage, the
reasons therefore.
9)
Contain a detailed
statement of the projected costs of the
redevelopment,
including
the amount to be expended on publicly funded capital projects in the
community
redevelopment area and any indebtedness of the community redevelopment
agency,
county, or the municipality proposed to be incurred for such
redevelopment if
such indebtedness is to be repaid with increment revenues.
10)
Provide a time certain
for completing all redevelopment
financed by increment revenues. Such
time shall occur no later then 30 years after the fiscal year in which
the plan
is approved, adopted, or amended pursuant to 163.361(1).
B. Redevelopment Trust
Fund
Following approval of
the CRA plan, a redevelopment trust fund shall be established for the
community
redevelopment area. Monies allocated to
and deposited in the trust fund are used by the CRA to finance
redevelopment in
the area pursuant to the plan. The
trust fund is created by the governing body through enactment of an
ordinance
establishing the fund. The ordinance
must also provide for the funding of the redevelopment trust for the
duration
of the redevelopment plan. The
ordinance also establishes the base level of aggregate assessed values
within
the redevelopment area for tax increment purposes at the level of the
most
recent assessment roll used for the taxation of real property in the
redevelopment area prior to the effective date of the ordinance. The amount of the increment is determined
annually and is 95 percent of the difference between the current ad
valorem
millage rate applied to the current real property assessed values
within the
redevelopment area and the current rate applied to the “frozen” level
of
aggregate property assessments. The
calculation of tax increment is according to the following formula:
current
assessed value minus base assessed value equals the incremental
increase in
value which is multiplied by the current millage rate to obtain the tax
increment increase. The required tax
increment amount is 95 percent of that amount.
The
City of Delray Beach jump-started its downtown planning in 1989 when
voters
approved a $21.5 million “Decade of Excellence of Bond” referendum that
enabled
the city to widen and brick pave sidewalks along East Atlantic Avenue,
install
new street lighting, and provide extensive plantings.
The City’s Community Redevelopment Agency (CRA) offers a variety
of financial and technical assistance programs to downtown investors
including
small business loans, historic façade easements, and site development
assistance. The CRA also engages in the
acquisition and disposition of distressed properties and vacant parcels
of
land. Land assemblage for redevelopment
purposes is perhaps the single most important function served by CRA’s
in South
Florida.
The City of Hollywood’s CRA has been active
in refurbishing their
downtown. In 1987, the CRA spent $1.8
million in streetscape improvements to Hollywood Boulevard. Improvements included new sidewalks, brick
pavers, median landscaping, streetlamps, and street furniture. Another $2.6 million was spent in 1996 for
streetscape improvements to Harrison Street in the downtown. Those improvements included widening of the
sidewalks to 15 feet, brick pavers, streetlamps, and landscaping. The CRA also provides low interest loans for
building improvements in the downtown.
Loans are available through local banks at the prime rate with
the city subsidizing one half of the
interest
payment. To date, the CRA has leveraged
nearly $3 million in loans for downtown building improvements.
Sustainable
neighborhood revitalization initiatives require that strong
institutional and
collaborative support mechanisms be established. At
the foundation of institutional and collaborative support is
the community’s workforce development capacity. A
recent survey of economic developers conducted by the Council
for Urban Economic Development (CUED) indicated that workforce
development is
their number one challenge. With many
states discussing the importance of human capital investment the
economic
necessity and advantage of workforce development is becoming more
apparent.
There is also now an increasing
understanding of the importance and effectiveness of partnering to
achieve
workforce development objectives.
Effective workforce development initiatives require private,
community,
inter- and intra-governmental coordination and integration. Community leaders or community associations,
including community development corporations (CDCs), can be very
effective in
identifying and mobilizing local resources.
Partnerships can also facilitate communication and help
government
agencies define their roles and responsibilities and thus avoid the
unnecessary
duplication of financial and human resources.
Currently,
efforts are underway to develop a Workforce 2020 program for Miami-Dade. The initiative is modeled after other
programs in Florida, but will be tailored to reflect the realities of
Miami’s
economy, population and business base, including its high unemployment,
diverse
workforce and seasonal tourism industry.
It is important that the Workforce 2020 program and other local
workforce development initiatives promote working private/public
partnerships. The 79th
Street Corridor Initiative, Inc. can provide a community leadership
role in
creating strategic alliances by networking with institutions from the
private,
public and non-profit sectors. An
inter-organizational workforce development network could forge
stronger, more
effective and sustainable linkages to the larger community but in the
interest
of further developing the social and economic capacity of the residents
of the
79th Street Corridor.
79th
Street Corridor Initiative Business Survey
Interview #____
Date_____________ Time Start_______ Time
Finish_______
Location______________________________________
Interviewer____________________________________
**Bring
extra copy of survey
so that respondent can read along.
**If
there are questions
they cannot answer, ask if there is another employee who can.
Date
Entered in
Database_______ Name_____________________
General
Business
Name: ___________________________________________________
Mailing
Address: ___________________________________________________
Phone
Number: ___________________________________________________
Name
of Owner: __________________________________________________
Title
of Interviewee: _______________________________________
1.
From
the following list, please tell me which category best describes your
business:
£
Service
£
Retail
£
Commercial
£
Industrial
£
Other
__________
2.
From
the following list, please tell me which category best describes your
business:
£
Subsidiary
of a Corporation
£
Headquarter
of a Corporation
£
Franchise
Affiliation
£
Family
Business
£
Self
Owned
£
Other_________
3.
When
was this business established? __________
4.
How
long has your business been located at the current address?
Years___ Months___
5.
I’m
going to read from a list of possible reasons why your business is at
this
location. Please indicate whether or not any of these apply.
£
Low
tax rate
£
Need
for your service in the area
£
Low
rent
£
Convenient
location
£
Large
amount of customer traffic
£
Other
_____________
6.
Is
your business planning on relocating in the next year? (if no, skip to
#8)
£
Yes
£
No
7.
If
yes, why? _________________
8.
Approximately
what was your pretax revenue for the 2000 fiscal year? ___________
9.
Compared
to the 1999 fiscal year, has this revenue:
£
Stayed
the same
£
Increased
£
Decreased
£
N/A
(new business)
10.
During
the next year, do you have plans to (check
all that apply):
£
Hire more
employees
£
Make
additions to your
building
£
Increase
in-stock inventory
£
Offer
new services/products
£
Other
expansion? ________
£
No
expansion plan
11.
If
your business suddenly began generating extra revenue what is the first
thing
you would expand (either from list above or other)?
_____________________________________________________________
12.
How
many full-time employees do you at this location (including owners/
yourself)
Full time? ___
13.
How many part time employees do you have?
_____
14.
I
am going to read from a list. Please indicate which resources your
business
used for finding employees (indicate all that apply)
£
Miami
Herald classified
£
Other
newspaper (name paper)________________
£
Word-of-mouth
(friends, relatives, etc.)
£
Sign
on business
£
Employment
service
£
Other
__________________
15.
What
is the highest level of education you have received?
16.
What
about your employees at this location? How many of them have a(n):
Advanced
Degreed (MA/PhD) ___
4-yr.
College Degree (BA/S) ___
Technical
or Associate Degree ___
High-school
diploma/GED
___
17.
How
many at this location speak English fluently? ___
18.
How
many at this location are bi/trilingual? ___
19.
How important
is it to you to hire people from this neighborhood?
£
Very important
£
Somewhat important
£
Not important at all
20.
What kind of
training do your employees receive at your business?
£
Orientation
£
On-site training
£
Other
21.
On average how long does
your typical employee work with
you?
£
1 to 3
Months
£
3 to 6
Months
£
6 Months
to a year
£
More than
a year
22.
Are you designated a minority
owned business by the government?
£
Yes
£
No
(if answer is “No” skip
to #24)
23. If yes, are there advantages you receive from this designation? (explain briefly)
_____________________________________________________________________________________________________________________________________________
24.
How did you get funding
to start your business (check all
that apply)?
(e.g., Bank loans,
Institutional
loans, Philanthropic loans, Grants, Community Development Block Grant
Funds
(CDBG), Personal finances)__________________________________
_________________________________________________________________________
25.
I’m
going to read a
list of business support services.
Please tell me if your business has heard of them and, if so,
has used
them.
e.g.:
“Have you heard of SCORE?” if yes: “Have you used
SCORE’s services?”
Heard Of?
Used?
A.
Community Developmental Corporations (CDCs)
Yes No Yes No
B.
City/County Economic Development Agencies (OCEDs)
Yes No Yes No
C. Beacon Council
Yes No Yes No
D. Better Business Bureau
Yes No Yes No
E. Tools for Change
Yes No Yes No
F. SCORE (Service Corps
of Retired
Executives)
Yes No Yes No
G. Metro-Miami Action
Plan Trust
(MMAP)
Yes No Yes No
H. Miami Capital
Development, Inc.
Yes No Yes No
I. WAGES Coalition
Yes No Yes No
Other _____________
We’re interested in
learning about types of training that
would benefit your business.
26.
Suppose you were offered
training for your business. From the list
of business skills/expertise
please indicate the level of interest your business has for training in
each of
these areas by answering no interest,
some interest, very interested. You
can answer “No opinion” or “Not sure”
Exp: “Preparing Tax Returns. Need
training? None
|
|
Level
of Need |
No interest |
Some interest |
Very interested |
N/A |
|
A |
Preparing
Tax Returns |
|
|
|
|
|
B |
Writing
Business Plans |
|
|
|
|
|
C |
Bookkeeping
Skills (understanding balance sheets/income statements) |
|
|
|
|
|
D |
Inventory
Control |
|
|
|
|
|
E |
Marketing
and Promotion of Business |
|
|
|
|
|
F |
Shopping
for Insurance |
|
|
|
|
|
G |
Using
Computers for Business |
|
|
|
|
|
H |
Using
Internet for Business |
|
|
|
|
|
I |
Negotiating
Business Loans |
|
|
|
|
|
J |
Understanding
Community Reinvestment Programs |
|
|
|
|
|
K |
Recruiting
and Interviewing Employees |
|
|
|
|
|
L |
Networking
with other Businesses |
|
|
|
|
|
M |
Other |
|
|
|
|
27.
Approximately what
percentage of your clientele is local
(from this neighborhood)?___
28.
Approximately what
percentage of your suppliers is local
(from this neighborhood)?____
29.
Do you (or the owners)
own or rent this business location?
£
Rent
£
Own
£
Other
30.
I am going to ask your
opinion about various aspects of
business conditions in this neighborhood.
Please indicate whether the listed items are good, average, or
bad. You can answer “no opinion” or “not
sure”. (Circle the answer.)
Exp.:
“General Business Opportunities. Are they
good, average, or bad in _______?”
|
A |
General Business Opportunities
|
Good |
Average |
Bad |
No Opinion / not sure |
|
B |
Getting Good Workers |
Good |
Average |
Bad |
No Opinion / not sure |
|
C |
Availability of Good Locations for Business |
Good |
Average |
Bad |
No Opinion / not sure |
|
D |
Convenient Access to/from Freeway |
Good |
Average |
Bad |
No Opinion / not sure |
|
E |
Getting Customers |
Good |
Average |
Bad |
No Opinion / not sure |
|
F |
Parking Spaces
|
Good |
Average |
Bad |
No Opinion / not sure |
|
G |
Obtaining Finance or Business
Loans
|
Good |
Average |
Bad |
No Opinion / not sure |
|
H |
Police Patrol
|
Good |
Average |
Bad |
No Opinion / not sure |
|
I |
Getting Reasonable Insurance
Coverage
|
Good |
Average |
Bad |
No Opinion / not sure |
|
J |
Marketing & Business
Promotion
|
Good |
Average |
Bad |
No Opinion / not sure |
|
K |
Clean Streets
|
Good |
Average |
Bad |
No Opinion / not sure |
|
L |
Timely Permitting &
Licensing
|
Good |
Average |
Bad |
No Opinion / not sure |
|
M |
Clear Road Signage
|
Good |
Average |
Bad |
No Opinion / not sure |
|
N |
Code Enforcement
|
Good |
Average |
Bad |
No Opinion / not sure |
|
O |
Garbage Collection
|
Good |
Average |
Bad |
No Opinion / not sure |
|
P |
Level of Crime
|
Good |
Average |
Bad |
No Opinion / not sure |
|
Q |
Usage of metro rail by
employees and clientele?
|
Good |
Average |
Bad |
No Opinion / not sure |
|
R |
#1 problem? (from above or
other)
|
|
|
|
|
|
|
|
|
|
|
|
Exterior Housing Conditions Survey
Categories:
Standard-Minor
Repairs
Substandard-Major
Repairs
Dilapidated
Definitions:
1.
Standard
Roof – new (1-5 years
estimated) roof or no visible signs of disrepair
Siding – new (1-3 years
estimated) siding, paint or stucco
Windows – new (1-5 years
estimated)
Doors – new (1-5 years estimated)
Porches – new 1-5 years estimated) with no
visible signs of
disrepair
Foundation – no visual signs of disrepair
Driveway – new (1-5 years estimated)
Landscaping – new or maintained
2.
Standard-Minor Repairs
Roof – few
loose/missing shingles/tiles; need of cleaning
Siding – in need of touch-up painting or
vinyl/stucco work
Windows – few cracked or missing panes; need of
caulking
Doors – in need of paint and new hardware
Porches – in need of paint or stain; warped or
cracked railings
Foundation – minor cracks
Driveway – minor cracks; need of coating or
cleaning
Landscaping – in need of maintenance
3.
Substandard-Major Repairs
Roof – replace aged
roof
Siding – replace aged siding or provide full
paint job
Windows – replace aged windows and frames
Doors – replace aged doors, frames and hardware
Porches – replace aged rails, flooring and
supports
Foundation – repair major cracks
Driveway – repair major cracks; replace
numerous tiles
Landscaping – cut or remove overgrown
vegetation; provide new
vegetation
4.
Dilapidated
Roof
– crumbling or
visible evidence of structural damage
Siding – falling or
leaning walls
Windows – rotting damage
Doors – rotting or broken
doors
Porches – rotting or
broken floors, rails and supports
Foundation – crumbling
Driveway – crumbling
or having major
holes
Landscaping – rotting
trees and other vegetation
[1]
To avoid
double counting, “race” represents the population who cited only one
race. The population citing “two or more
races” is
shown separately.
[2] “Hispanic”
overlaps with race (could be white or black Hispanic).
[3]
Percentages of family households with children <18 and single
females with
children <18 represent percentage of total households.
[4] Using County Land Use
Codes (CLUC) this residential
aggregate includes: Single-Family, two family, multi-family, and other
residential. Omitted one “Mobile
Home
Park” because data inconsistency. Omitted 16 cases that showed building
square
footage equal to 0. Dates indicate that
buildings on these folios were not yet completed as of the value
assessment
date and therefore left blank (including in data would skew results).
Omitted a
case that showed building square footage value equaling $113.01, over
twice the
value of the next lowest $per square footage.
Case was determined to be an outlier that threatened to skew the
data.
[5] Omitted outlier, D Dungle
& P Moore property
valued at $650,000.00.